 Slovenski INSPIRE metapodatkovni sistem
Keyword
gostota površinskega toplotnega toka
3 record(s)
Type of resources
Categories
INSPIRE themes
Keywords
Formats
Representation types
Scale
-
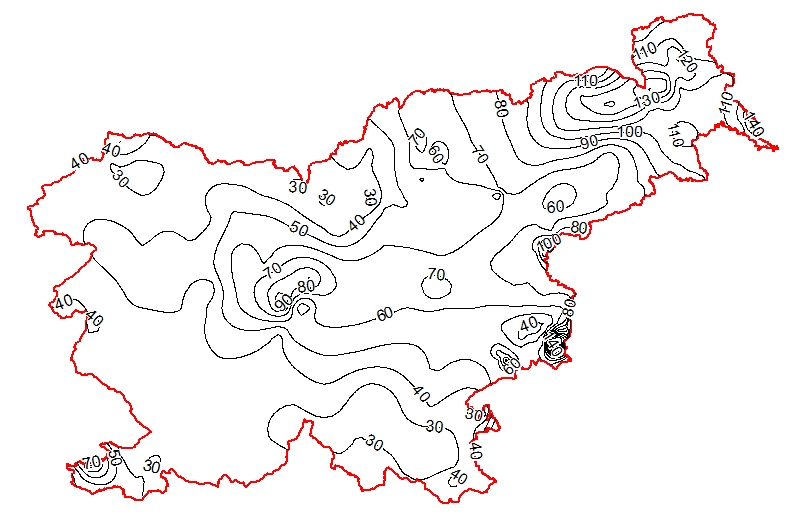
Map represents the calculated (surface) heat-flow density (HFD) in mW/m2 with topographic correction. It is made with data from 119 boreholes from the measured temperatures in the available boreholes and measured thermal conductivity on cored rock samples from the same boreholes. The pattern of the HFD isolines is affected by numerous parameters, particularly the thermal conductivity of rocks, rock permeability and fracturing, fluid content of the rocks, and all are reflected in the measured temperature gradient in the boreholes.
-
Map represents the calculated (surface) heat-flow density (HFD) in mW/m2 with topographic correction. It is made with data from 119 boreholes from the measured temperatures in the available boreholes and measured thermal conductivity on cored rock samples from the same boreholes. The pattern of the HFD isolines is affected by numerous parameters, particularly the thermal conductivity of rocks, rock permeability and fracturing, fluid content of the rocks, and all are reflected in the measured temperature gradient in the boreholes.